sshuttle: where transparent proxy meets VPN meets ssh
https://sshuttle.readthedocs.io/en/stable/overview.html
sshuttle: where transparent proxy meets VPN meets ssh
https://sshuttle.readthedocs.io/en/stable/overview.html
GPON stands for Gigabit Passive Optical Network.
It’s a type of fiber-optic broadband technology used by internet service providers (ISPs) to deliver high-speed internet, TV, and phone services to homes and businesses.
Under EU law (eIDAS 910/2014), electronic signatures can be:
SES – Simple Electronic Signature (basic: typed name, click-to-sign, tickbox).
AdES – Advanced Electronic Signature (cryptographically bound to the signer, integrity-protected).
QES – Qualified Electronic Signature (requires a qualified certificate + secure signing device; legally equivalent to handwritten signature in the EU).
👉 Signi supports SES, AdES, and in certain cases QES (e.g. with BankID or qualified certificates).
Signer Identification
Signi asks for the signer’s mobile number.
The system sends a one-time code (OTP) via SMS.
OTP Entry
The signer enters the OTP on the Signi platform.
If the code matches, Signi confirms the signer’s control of that phone number.
Binding to Document
Signi records:
Mobile number used
IP address
Timestamp of verification
The verification is stored in the audit trail attached to the signed document.
SMS verification alone is considered “Simple Electronic Signature (SES)”.
It does not use a cryptographic certificate by default.
Legally:
SES is sufficient for internal approvals or contracts between trusted parties.
SES is not automatically QES or advanced (AdES) — i.e., it may be challenged in court if the signer’s identity is disputed.
Some platforms combine SMS verification with cryptographic signatures or BankID:
The SMS ensures the signer received the document.
The crypto certificate binds the signature to the document securely.
This approach increases legal weight, approaching AdES.
Pros
Easy to use, no special device required.
Lightweight and fast.
Cons
SMS is vulnerable to SIM swapping or interception.
Not legally equivalent to handwritten signatures in most EU jurisdictions on its own.
✅ In short: SMS authentication in Signi is a convenient way to verify signer control, but it doesn’t replace a qualified or advanced electronic signature if strong legal enforceability is required.
Original Source: https://fohdeesha.com/docs/perc.html
This guide allows you to crossflash 12th gen Dell Mini Mono & full size cards to LSI IT firmware. Mini Mono refers to the small models that fit in the dedicated "storage slot" on Dell servers. Because iDRAC checks the PCI vendor values of cards in this slot before allowing the server to boot, the generic full-size PERC crossflashing guides do not apply. This guide however solves that issue. Technical explanation for those curious. The following cards are supported:
There's two main reasons to do this, assuming you don't need the hardware RAID functionalities of the stock firmware:
Better Performance: the plain LSI IT firmware in this guide drastically increases the max queue depth of the adapter. For instance on the H310 Mini, it goes from 25 with the stock Dell RAID firmware to 600 with the LSI IT firmware. This can mean drastic improvements in IOPS with heavy SSD configurations for example.
Different Driver: The stock Dell firmware (MegaRAID-based) uses the MegaRAID driver in Linux/FreeBSD/etc. In some distributions this can cause issues, for example FreeNAS has issues pulling SMART data from drives connected to a MegaRAID controller. After crossflashing to IT mode, the card is used by the OS via the much simpler mpt3sas driver.
Ensure there is only one LSI-based adapter in your system. If there are others besides the adapter you intend to flash, remove them! You also need to disable a few BIOS settings. This step is not optional. In your server BIOS, disable all of the following:
You also must set the server boot mode to BIOS, not UEFI:
Note: If you're flashing a card on a non-Dell system, such as an AMD based desktop or server, make sure you find any BIOS settings related to IOMMU and Virtualization, and disable them
When you're finished with this guide, don't forget to go back and enable Virtualization, as well as SR-IOV if you plan to use it. Switch boot mode back to UEFI as well if you were using it previously. But only once you've finished the guide!
Remove the RAID battery from the adapter. The IT firmware has no cache for the battery to back, in fact the IT firmware will have no clue the battery is there if you leave it connected. To make matters worse, in rare cases some people observed the battery holding old Dell code in the card's RAM and it made their crossflash process a pain. Just unplug/remove the battery and store it somewhere in case you return to Dell firmware.
Remove all drives connected to the PERC. This typically means any drives in the front of the server in the hot swap bays. If you forget to do this, the flashing process won't touch them or alter them, but having them connected can cause the flash process to fail and you'll be left wondering why. So pull the caddies for now!
Download the ZIP below which contains two ISOs. One
is a FreeDOS live image, the other is a Debian live image. Both come
prepackaged with all the required tools and files, and they can be
booted either via iDRAC virtual media or by burning them to a flash
drive via Rufus in WIndows, using dd
in Linux, or your favorite flashing utility - up to you. If you use
Ventoy, make sure to boot the FreeDOS image in memdisk mode.
Dell Perc Flashing ZIP
Version: v2.5
ZIP Updated: 09-28-2023
MD5: d7f5f926626b295f7005c4c927158569
I HAVE MY OWN COPY of DELL_PERC_FLASHING here.
Boot the server off the FreeDOS ISO. Once it's booted just run the following command, it will spit out the name and revision of your card:
info
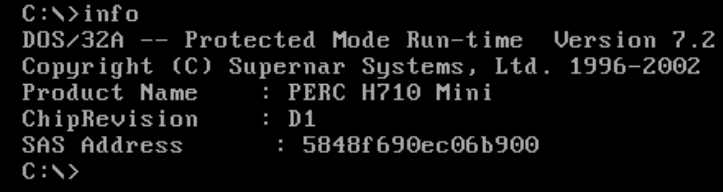
WARNING: If you are flashing a card in a blade chassis (like an M620 or M820), only use the "for blades" section for your card model below. Blade servers are the M620 and M820 for instance. Standard rackmount models like the R620 and R720 are not blade servers!
In my case, we should see PERC H310 Mini
Continued instructions for flashing the H310 Mini Mono. You should only continue here after following the Introduction Page. If you haven't done so already, go back.
You should still be in the FreeDOS live boot image. Double check you are on the right guide by running the following command again:
info
Product Name : H310 Mini
ChipRevision : B2
SAS Address  : xxxx (will differ)
You also need to note the SAS address of the card from the above output so we can program it back later. Take a screenshot of the console, or otherwise note down the address so you can write it back at the end of the guide. It's not a huge deal if you lose it, but it's easiest to program back the original address instead of generating a new one.
Still in FreeDOS, run the following command to wipe the flash on the card and get rid of all Dell firmware. This will also flash the required SBR:
310MNCRS
reboot
You should now be booted into the Linux ISO from the ZIP. Use the following credentials to login: user/live
We highly recommend SSH'ing to the live ISO so you can copy/paste commands and not have to use the iDRAC virtual console. To do so, run the following to find the IP of the install:
ipinfo
Now, still in Linux, we need to change to the root user:
sudo su -
H310
Note: For some reason, the very first boot after crossflashing the card will cause a kernel panic - I believe it's iDRAC not letting go of something (I was able to see the card put in a fault state via the debug UART when this happens). This only happens the first reboot after crossflashing. When you boot back into the live ISO and get the panic, either let it reboot itself, or use iDRAC to force a reboot. After that boot back into the live ISO again and all will be well.
Now rebooted back into the live Linux image, just run the following commands, filling in the example address with your own, that you noted down earlier:
sudo su -
setsas 500605b123456777
info
        Controller Number              : 0
        Controller                     : SAS2008(B2)
        PCI Address                    : 00:02:00:00
        SAS Address                    : 5b8ca3a-0-f37a-4500
        NVDATA Version (Default)       : 14.01.00.08
        NVDATA Version (Persistent)    : 14.01.00.08
        Firmware Product ID            : 0x2213 (IT)
        Firmware Version               : 20.00.07.00
        NVDATA Vendor                  : LSI
        NVDATA Product ID              : SAS9211-8i
        BIOS Version                   : N/A
        UEFI BSD Version               : N/A
        FCODE Version                  : N/A
        Board Name                     : SAS9211-8i
        Board Assembly                 : N/A
        Board Tracer Number            : N/A
Note: flashing these can add up to 2 minutes to server boot time if you have a lot of drives. Be sure you need them!
If you need to boot from drives connected to this adapter, you'll need to flash a boot image to it. Otherwise, skip it. This is what gives you the "press blahblah to enter the LSI boot configuration utility" text when the server boots. To flash the regular BIOS boot image:
flashboot /root/Bootloaders/mptsas2.rom
flashboot /root/Bootloaders/x64sas2.rom
If for some reason you need to revert back to the stock Dell PERC firmware, that's easy. Boot into the FreeDOS live image, and run the following command:
310REVRT
reboot command.
Note: This uses the unmodified latest Dell firmware
20.13.3-0001,A11extracted from the update EXE found here.
Hardware
E-Shop: https://dratek.cz/
Training videos:
Here is the process how to get Device ID and Local Key for Tuya device.
Pro převod souboru z MKV na MP4 pomocí ffmpeg použij následující příkaz:
ffmpeg -i vstup.mkv -codec copy vystup.mp4
Pokud MKV obsahuje kodeky, které nejsou kompatibilní s MP4 (např. některé titulky nebo audio kodeky), můžeš použít překódování:
ffmpeg -i vstup.mkv -c:v libx264 -c:a aac -strict experimental vystup.mp4
Because of sustainability, I would like to use old Laptop/Printer/Scanner devices.
This blog post is focused on Printer and Scanner.
I have a Canon MX350, so the runbooks for installing and using the printer and scanner were tested only with this model.
[SKIP - NOT USED] Install driver for NVIDIA Graphics Card
[SKIP - NOT USED] Configure the NVIDIA driver in a configuration file
[SKIP - NOT USED] NVIDIA configuration (it creates /etc/X11/xorg.conf)
Here is the Onliner to list VMs with custom attribute "Last Backup" ...
Get-VM | Select-Object Name, @{N='LastBackup';E={($_.CustomFields | Where-Object {$_.Key -match "Last Backup"}).Value}} | Where-Object {$_.LastBackup -ne $null -and $_.LastBackup -ne ""}
and here is the another one to count the number of such VMs ...
Get-VM | Select-Object Name, @{N='LastBackup';E={($_.CustomFields | Where-Object {$_.Key -match "Last Backup"}).Value}} | Where-Object {$_.LastBackup -ne $null -and $_.LastBackup -ne ""} | Measure-Object | Select-Object Count
How to get all VMs restarted by VMware vSphere HA? PowerCLI OneLiner below will do the magic ...
Get-VIEvent -MaxSamples 100000 -Start (Get-Date).AddDays(-1) -Type Warning | Where {$_.FullFormattedMessage -match "restarted"} | select CreatedTime,FullFormattedMessage | sort CreatedTime -Descending | Format-Table
I'm using Linux Mint with xsane for scanning documents on my old but still good Canon MX350 printer/scanner. Scans are saved as huge PDF documents (for example 50 MB) and I would like to compress it to consume much less disk space.
Install Ghostscript
apt install ghostscript
Compress the file input.pdf
gs -sDEVICE=pdfwrite -dCompatibilityLevel=1.4 -dPDFSETTINGS=/ebook -dNOPAUSE -dQUIET -dBATCH -sOutputFile=output_compressed.pdf input.pdf
Let's break down these options
Lossy compression (322x) from 50 MB to 155 KB without any visible degradation is worth to keep cloud (Google drive) costs low.
My preferred editor in unix-like systems is vi or vim. VI is everywhere and VIM is improved for scripting and coding.
Below is my VIM config file /home/dpasek/.vimrc
 syntax on
 filetype plugin indent on

 " Show line numbers
 set number

 " Show relative line numbers (optional, good for motions like 5j/5k)
 " set relativenumber
 " Highlight matching parentheses
 set showmatch

 " Enable auto-indentation
 set smartindent
 set autoindent

 " Use spaces instead of tabs, and set width (adjust to taste)
 set expandtab
 set tabstop=4
 set shiftwidth=4
 set softtabstop=4

 " Show line and column in status line
 set ruler

 " Show partial command in bottom line
 set showcmd

 " Show a vertical line at column 80 (optional)
 set colorcolumn=80

 " Disable VIM mouse handling and keep it to terminal
 set mouse=

 " Enable persistent undo (requires directory)
 set undofile
 set undodir=~/.vim/undodir

 " Make backspace behave sanely
 set backspace=indent,eol,start

 " Enable searching while typing
 set incsearch
 set hlsearch     " Highlight all matches
 set ignorecase    " Case insensitive search...
 set smartcase     " ...unless capital letter used

 " Status line always visible
 set laststatus=2
You can do a native VCF SDDC Manager backup via SFTP protocol. SFTP is a file transfer protocol that operates over the SSH protocol. When using SFTP for VMware VCF's backup, you're effectively using the SSH protocol for transport.
For VCF older than 5.1, you have to allow ssh-rsa algorithm for host key and user authentication on your SSH Server.
It is configurable in SSH Daemon Configuration (/etc/ssh/sshd_config) on your backup server should have following lines to allow ssh-rsa algorithm for host key and user authentication.
How to use RaspberryPi inputs and outputs? The easiest way is to use the GPIO pins directly on the RaspberryPi board.
Raspberry Pi has 8 freely accessible GPIO ports. which can be controlled. In the following picture they are colored green.
 |
| GPIO ports |
Attention!!! GPIO are 3.3V and do not tolerate 5V !! Maximum current is 16mA !! It would be possible to use more of them by changing the configuration.
First you need to install the ligthhttpd (or apache ) server and PHP5:
sudo groupadd www-data
sudo apt-get install lighttpd
sudo apt-get install php5-cgi
sudo lighty-enable-mod fastcgi
sudo adduser pi www-data
sudo chown -R www-data:www-data /var/www
In the lighthttpd configuration
you need to add:
bin-path" => "/usr/bin/php5-cgi
socket" => "/tmp/php.socket"
Now you need to restart lighthttpd:
sudo /etc/init.d/lighttpd force-reload
This will run our webserver with PHP.
Now we get to the actual GPIO control. The ports can be used as input and output. Everything needs to be done as root.
First you need to make the port accessible:
echo "17" > /sys/class/gpio/export
Then we set whether it is an input (in) or output (out):
echo "out" > /sys/class/gpio/gpio17/direction
Set the value like this:
echo 1 > /sys/class/gpio/gpio17/valu
Read the status:
cat /sys/class/gpio/gpio17/value
This way we can control GPIO directly from the command line. If we use the www interface for control, we need to set the rights for all ports so that they can be controlled by a user other than root.
chmod 666 /sys/class/gpio/gpio17/value
chmod 666 /sys/class/gpio/gpio17/direction
"In this post I will show you how to create a template in XenOrchestra and using an image we created and customized ourself. " ... full blog post is available at https://blog.bufanda.de/how-to-create-a-template-on-xcp-ng-with-xenorchestra/
During the investigation of high disk response times in one VM using vSAN storage, I saw a strange vSAN metric (TCP Connection Half Open Drop Rate).
What is it?
Here is the screenshot of vSAN ESA - Half Open Drop Rate over 50% on some vSAN Nodes ...
 |
| vSAN ESA - Half Open Drop Rate over 50% on some vSAN Nodes |
Here is the physical infrastructure schema of VMware vSAN ESA cluster ...
 |
| The schema of Physical infrastructure |
Here is the virtual networing schema of VMware vSphere ESXi host (vSAN Node) participating in vSAN ESA cluster ...
 |
| Virtual Networking of ESXi Host (vSAN Node) |
I have seen high virtual disk latency on VM (docker host with single NVMe vDisk) with the storage load less than 12,000 IOPS (IOPS limit set to 25,000), so that was the reason why I was checking vSAN ESA infrastructure deeper and found the TCP Half Open Drop "issue".
 |
| High vDisk (vNVMe) response times in first week of February |
However, IOmeter in Windows server with single SCSI vDisk on SCSI0:0 adapter is able to generate almost 25,000 IOPS @ 0.6 ms response time of 28.5KB-100%_read-100%_random storage pattern with 12 workers (threads).
 |
| 12 workers on SCSI vDisk - we see performance of 25,000 IOPS @ 0.6 ms response time |
 |
| Single worker (thread) with 4KB I/O size |
 |
| 64 workers on SCSI vDisk we see performance of 108,000 IOPS @ 0.6 ms response time |
 |
| 128 workers on SCSI vDisk we see performance of 98,300 IOPS @ 1.3 ms response time |
 |
| 128 workers on NVMe vDisk we see performance of 108,000 IOPS @ 1.2 ms response time |
 |
| 64 workers on NVMe vDisk we see performance of 110,000 IOPS @ 0.6 ms response time |
What is happening in vSAN Node (dcserv-esx06) in maintenance mode with all vSAN storage migrated out of node?
[root@dcserv-esx06:/usr/lib/vmware/vsan/bin]
pktcap-uw --uplink vmnic4 --capture UplinkRcvKernel,UplinkSndKernel -o -
| tcpdump-uw -r - 'src host 192.168.123.22 and tcp[tcpflags] &
tcp-syn != 0 and tcp[tcpflags] & tcp-ack == 0'
The name of the uplink is vmnic4.
The session capture point is UplinkRcvKernel,UplinkSndKernel.
pktcap: The output file is -.
pktcap: No server port specifed, select 30749 as the port.
pktcap: Local CID 2.
pktcap: Listen on port 30749.
pktcap: Main thread: 305300921536.
pktcap: Dump Thread: 305301452544.
pktcap: The output file format is pcapng.
pktcap: Recv Thread: 305301980928.
pktcap: Accept...
reading from file -pktcap: Vsock connection from port 1032 cid 2.
, link-type EN10MB (Ethernet), snapshot length 65535
09:19:52.104211
IP 192.168.123.22.52611 > 192.168.123.23.2233: Flags [SEW], seq
2769751215, win 65535, options [mss 8960,nop,wscale 9,sackOK,TS val
401040956 ecr 0], length 0
09:20:52.142511 IP 192.168.123.22.55264
> 192.168.123.23.2233: Flags [SEW], seq 3817033932, win 65535,
options [mss 8960,nop,wscale 9,sackOK,TS val 1805625573 ecr 0], length 0
09:21:52.182787
IP 192.168.123.22.57917 > 192.168.123.23.2233: Flags [SEW], seq
2055691008, win 65535, options [mss 8960,nop,wscale 9,sackOK,TS val
430011832 ecr 0], length 0
09:22:26.956218 IP 192.168.123.22.59456
> 192.168.123.23.2233: Flags [SEW], seq 3524784519, win 65535,
options [mss 8960,nop,wscale 9,sackOK,TS val 2597182302 ecr 0], length 0
09:22:52.225550
IP 192.168.123.22.60576 > 192.168.123.23.2233: Flags [SEW], seq
3089565460, win 65535, options [mss 8960,nop,wscale 9,sackOK,TS val
378912106 ecr 0], length 0
09:23:52.397431 IP 192.168.123.22.63229
> 192.168.123.23.2233: Flags [SEW], seq 2552721354, win 65535,
options [mss 8960,nop,wscale 9,sackOK,TS val 2409421282 ecr 0], length 0
09:24:52.436734
IP 192.168.123.22.12398 > 192.168.123.23.2233: Flags [SEW], seq
3269754737, win 65535, options [mss 8960,nop,wscale 9,sackOK,TS val
3563144147 ecr 0], length 0
09:25:52.476565 IP 192.168.123.22.15058
> 192.168.123.23.2233: Flags [SEW], seq 1510936927, win 65535,
options [mss 8960,nop,wscale 9,sackOK,TS val 1972989571 ecr 0], length 0
09:26:52.515032
IP 192.168.123.22.17707 > 192.168.123.23.2233: Flags [SEW], seq
262766144, win 65535, options [mss 8960,nop,wscale 9,sackOK,TS val
3787605572 ecr 0], length 0
09:27:52.554904 IP 192.168.123.22.20357
> 192.168.123.23.2233: Flags [SEW], seq 2099691233, win 65535,
options [mss 8960,nop,wscale 9,sackOK,TS val 2472387791 ecr 0], length 0
09:28:52.598409
IP 192.168.123.22.23017 > 192.168.123.23.2233: Flags [SEW], seq
1560369055, win 65535, options [mss 8960,nop,wscale 9,sackOK,TS val
688302913 ecr 0], length 0
09:29:52.641938 IP 192.168.123.22.25663
> 192.168.123.23.2233: Flags [SEW], seq 394113563, win 65535, options
[mss 8960,nop,wscale 9,sackOK,TS val 3836880073 ecr 0], length 0
09:30:52.682276
IP 192.168.123.22.28221 > 192.168.123.23.2233: Flags [SEW], seq
4232787521, win 65535, options [mss 8960,nop,wscale 9,sackOK,TS val
830544087 ecr 0], length 0
09:31:52.726506 IP 192.168.123.22.30871
> 192.168.123.23.2233: Flags [SEW], seq 3529232466, win 65535,
options [mss 8960,nop,wscale 9,sackOK,TS val 3037414646 ecr 0], length 0
09:32:52.768689
IP 192.168.123.22.33520 > 192.168.123.23.2233: Flags [SEW], seq
3467993307, win 65535, options [mss 8960,nop,wscale 9,sackOK,TS val
3716244554 ecr 0], length 0
09:33:52.809641 IP 192.168.123.22.36184
> 192.168.123.23.2233: Flags [SEW], seq 2859309873, win 65535,
options [mss 8960,nop,wscale 9,sackOK,TS val 1556603624 ecr 0], length 0
09:34:52.849282
IP 192.168.123.22.38830 > 192.168.123.23.2233: Flags [SEW], seq
891574849, win 65535, options [mss 8960,nop,wscale 9,sackOK,TS val
226049490 ecr 0], length 0
09:35:52.889434 IP 192.168.123.22.41487
> 192.168.123.23.2233: Flags [SEW], seq 1629372626, win 65535,
options [mss 8960,nop,wscale 9,sackOK,TS val 100385827 ecr 0], length 0
09:36:52.931192
IP 192.168.123.22.44140 > 192.168.123.23.2233: Flags [SEW], seq
3898717755, win 65535, options [mss 8960,nop,wscale 9,sackOK,TS val
3230029896 ecr 0], length 0
09:37:52.972758 IP 192.168.123.22.46788
> 192.168.123.23.2233: Flags [SEW], seq 3798420138, win 65535,
options [mss 8960,nop,wscale 9,sackOK,TS val 1400467195 ecr 0], length 0
09:38:53.013565
IP 192.168.123.22.49449 > 192.168.123.23.2233: Flags [SEW], seq
1759807546, win 65535, options [mss 8960,nop,wscale 9,sackOK,TS val
1072184991 ecr 0], length 0
09:39:53.055394 IP 192.168.123.22.52096
> 192.168.123.23.2233: Flags [SEW], seq 2996482935, win 65535,
options [mss 8960,nop,wscale 9,sackOK,TS val 3573008833 ecr 0], length 0
09:40:53.095123
IP 192.168.123.22.54754 > 192.168.123.23.2233: Flags [SEW], seq
103237119, win 65535, options [mss 8960,nop,wscale 9,sackOK,TS val
3275581229 ecr 0], length 0
09:41:53.136593 IP 192.168.123.22.57408
> 192.168.123.23.2233: Flags [SEW], seq 2105630912, win 65535,
options [mss 8960,nop,wscale 9,sackOK,TS val 1990595855 ecr 0], length 0
09:42:53.178033
IP 192.168.123.22.60054 > 192.168.123.23.2233: Flags [SEW], seq
4245039293, win 65535, options [mss 8960,nop,wscale 9,sackOK,TS val
296668711 ecr 0], length 0
09:43:38.741557 IP 192.168.123.22.62070
> 192.168.123.23.2233: Flags [SEW], seq 343657957, win 65535, options
[mss 8960,nop,wscale 9,sackOK,TS val 3406471577 ecr 0], length 0
09:43:53.219844
IP 192.168.123.22.62713 > 192.168.123.23.2233: Flags [SEW], seq
452468561, win 65535, options [mss 8960,nop,wscale 9,sackOK,TS val
3555078978 ecr 0], length 0
09:44:53.264107 IP 192.168.123.22.11779
> 192.168.123.23.2233: Flags [SEW], seq 3807775128, win 65535,
options [mss 8960,nop,wscale 9,sackOK,TS val 3836709718 ecr 0], length 0
09:45:53.306117
IP 192.168.123.22.14431 > 192.168.123.23.2233: Flags [SEW], seq
3580778695, win 65535, options [mss 8960,nop,wscale 9,sackOK,TS val
3478626421 ecr 0], length 0
09:46:53.348438 IP 192.168.123.22.17083
> 192.168.123.23.2233: Flags [SEW], seq 1098229669, win 65535,
options [mss 8960,nop,wscale 9,sackOK,TS val 2219974257 ecr 0], length 0
09:47:53.386992
IP 192.168.123.22.19737 > 192.168.123.23.2233: Flags [SEW], seq
1338972264, win 65535, options [mss 8960,nop,wscale 9,sackOK,TS val
708281300 ecr 0], length 0
09:48:53.426861 IP 192.168.123.22.22389
> 192.168.123.23.2233: Flags [SEW], seq 3973038592, win 65535,
options [mss 8960,nop,wscale 9,sackOK,TS val 3153895628 ecr 0], length 0
09:49:53.469640
IP 192.168.123.22.25046 > 192.168.123.23.2233: Flags [SEW], seq
2367639206, win 65535, options [mss 8960,nop,wscale 9,sackOK,TS val
3155172682 ecr 0], length 0
09:50:53.510996 IP 192.168.123.22.27703
> 192.168.123.23.2233: Flags [SEW], seq 515312838, win 65535, options
[mss 8960,nop,wscale 9,sackOK,TS val 3434645295 ecr 0], length 0
How does TCP SYN/SYN-ACK behave between DCSERV-ESX06 and other vSAN nodes?
ESXi command to sniff TCP SYN from DCSERV-ESX06 (192.168.123.23) to DCSERV-ESX07 (192.168.123.23) is
pktcap-uw --uplink vmnic4 --capture UplinkRcvKernel,UplinkSndKernel -o - | tcpdump-uw -r - 'src host 192.168.123.22 and dst host 192.168.123.23 and tcp[tcpflags] & tcp-syn != 0 and tcp[tcpflags] & tcp-ack == 0'
Command to sniff TCP SYN-ACK is
pktcap-uw --uplink vmnic4 --capture UplinkRcvKernel,UplinkSndKernel -o - | tcpdump-uw -r - 'src host 192.168.123.23 and dst host 192.168.123.22 and tcp[tcpflags] & (tcp-syn|tcp-ack) = (tcp-syn|tcp-ack)'
Here are observations and screenshots from sniffing excercise.
No new TCP connections have been initiated between DCSERV-ESX06 (backup vSAN node) and DCSERV-ESX05 (agent vSAN node) in some limited sniffing time (several minutes).

Between DCSERV-ESX06 (192.168.123.22, backup vSAN node) and DCSERV-ESX07 (192.168.123.23, agent vSAN node) new TCP Connection is established (SYN/SYN-ACK) every minute.

No new TCP connections have been initiated between DCSERV-ESX06 (192.168.123.22, backup vSAN node) and DCSERV-ESX08 (192.168.123.24, agent vSAN node) in some limited sniffing time (several minutes).

No new TCP connections have been initiated between DCSERV-ESX06 (192.168.123.22, backup vSAN node) and DCSERV-ESX09 (192.168.123.25, agent vSAN node) in some limited sniffing time (several minutes).


Interesting observation
New TCP Connection between DCSERV-ESX06 (192.168.123.22, backup vSAN node) and DCSERV-ESX07 (192.168.123.23, agent vSAN node) is usually established (SYN/SYN-ACK) every minute.
Why this happening only between DCSERV-ESX06 (backup node) and DCSERV-ESX07 (agent node) and not with other nodes? I do not know.
Next step is to collect TCP SYN, TCP SYN/ACK, TCP stats, and NET stats on DCSERV-ESX06 (most "problematic" vSAN node) and DCSERV-ESX10 (not "problematic" vSAN node) into the files. I will capture data during one hour (60 minutes) to be able to compare number of SYN and SYN/ACK packets and compare it with TCP and network statistics.
Capturing of TCP SYN
timeout -t 3600 pktcap-uw --uplink vmnic4 --capture UplinkRcvKernel,UplinkSndKernel -o - | tcpdump-uw -r - 'tcp[tcpflags] & tcp-syn != 0 and tcp[tcpflags] & tcp-ack == 0' > /tmp/dcserv-esx06_tcp-syn.dump
timeout -t 3600 pktcap-uw --uplink vmnic4 --capture
UplinkRcvKernel,UplinkSndKernel -o - | tcpdump-uw -r - 'tcp[tcpflags]
& tcp-syn != 0 and tcp[tcpflags] & tcp-ack == 0' >
/tmp/dcserv-esx10_tcp-syn.dump
Capturing of TCP SYN/ACK
timeout -t 3600 pktcap-uw --uplink vmnic4 --capture UplinkRcvKernel,UplinkSndKernel -o - | tcpdump-uw -r - 'tcp[tcpflags] & (tcp-syn|tcp-ack) = (tcp-syn|tcp-ack)' > /tmp/dcserv-esx06_tcp-syn_ack.dump
timeout -t 3600 pktcap-uw --uplink vmnic4 --capture UplinkRcvKernel,UplinkSndKernel -o - | tcpdump-uw -r - 'tcp[tcpflags] & (tcp-syn|tcp-ack) = (tcp-syn|tcp-ack)' > /tmp/dcserv-esx10_tcp-syn_ack.dump
Capturing of TCP Statistics
for i in $(seq 60); do { date; vsish -e get /net/tcpip/instances/defaultTcpipStack/stats/tcp; } >> /tmp/dcserv-esx06_tcp_stats; sleep 60; done
for i in $(seq 60); do { date; vsish -e get /net/tcpip/instances/defaultTcpipStack/stats/tcp; } >> /tmp/dcserv-esx10_tcp_stats; sleep 60; done
Capturing of TCP Statistics
netstat captures 60 min with 30 sec x 120 times = 3600 sec = 60 min
for i in $(seq 120); do { date; net-stats -A -t WwQqihVv -i 30; } >> /tmp/dcserv-esx06_netstats ; done
for i in $(seq 120); do { date; net-stats -A -t WwQqihVv -i 30; } >> /tmp/dcserv-esx10_netstats ; done
Output Files Comparison
ESX06
tcpdump
15:48:32.422347 - 16:48:16.542078: 199 TCP SYN
15:49:16.434140 - 16:48:46.533262: 199 TCP SYN/ACK
Fri Mar 7 15:49:10 UTC 2025
tcp_statistics
connattempt:253432751
accepts:3996127
connects:8341861
drops:4778493
conndrops:247894569
minmssdrops:0
closed:257671058
Fri Mar 7 16:48:10 UTC 2025
tcp_statistics
connattempt:253587720
accepts:3997071
connects:8345071
drops:4781004
conndrops:248047267
minmssdrops:0
closed:257827086
tcp_statistics difference
connattempt:154969
accepts:944
connects:3210
drops:2511
conndrops:152698
minmssdrops:0
closed:156028
ESX10
tcpdump
15:49:44.554242 - 16:49:16.544940: 179 TCP SYN
15:50:16.441776 - 16:49:54.142493: 185 TCP SYN/ACK
Fri Mar 7 15:50:49 UTC 2025
tcp_statistics
connattempt:826534
accepts:2278888
connects:3105348
drops:1414905
conndrops:74
minmssdrops:0
closed:3338137
Fri Mar 7 16:49:49 UTC 2025
tcp_statistics
connattempt:826864
accepts:2279789
connects:3106579
drops:1415439
conndrops:74
minmssdrops:0
closed:3339470
Difference
connattempt:330
accepts:901
connects:1231
drops:534
conndrops:0
minmssdrops:0
closed:1333
What does it mean? I don't know. I have VMware support case opened and waiting on their analysis.
Your capture is highly filtered and many details are missing. Please consider the following points when collecting the capture:
You can use a command similar to below one:
pktcap-uw --vmk <vmk> --proto 0x6 --dir 2 -o <file.pcap>
pktcap-uw --uplink <vmnic> --proto 0x6 --dir 2 -o <file.pcap>
My vSAN ESA vmkernel interface is pined to vmnic4, therefore I used following command
It is good to monitor datastore usage as it dumps 30GB of network trafic in 4 minutes.
VMware support asked me for another packet capturing. They want packet capture not only from uplink used for vSAN traffic (VMKNIC4), but also from uplinks VMKNIC0, VMKNIC1, and VMKNIC5, where if vSphere management traffic.
Below is onliner I used to capture network traffic and split it into ~2 GB (2,000 MB) files as requested by VMware support.
Explanation of onliner above:
I've sent this new packet capture to VMware Support again and waited for their response.
Hello David,
Etcd is the misbehaving application. Looks like some of the hosts (100.68.81.23 and 100.68.81.21) dont have etcd configured and this host is trying to reach them. Can you help check why this configuration is missing on some of the hosts.
34 0.087251 0.000057000 100.68.81.23 100.68.81.22 2380 → 58192 [RST, ACK] Seq=0 Ack=2589825032 Win=0 Len=0 34
35 0.087370 0.000119000 100.68.81.23 100.68.81.22 2380 → 58193 [RST, ACK] Seq=0 Ack=1816019462 Win=0 Len=0 35
38 0.093287 0.000060000 100.68.81.21 100.68.81.22 2380 → 58194 [RST, ACK] Seq=0 Ack=3524013708 Win=0 Len=0 38
39 0.093407 0.000120000 100.68.81.21 100.68.81.22 2380 → 58195 [RST, ACK] Seq=0 Ack=2552292164 Win=0 Len=0 39
42 0.186674 0.000065000 100.68.81.23 100.68.81.22 2380 → 58196 [RST, ACK] Seq=0 Ack=428680618 Win=0 Len=0 42
43 0.186793 0.000119000 100.68.81.23 100.68.81.22 2380 → 58197 [RST, ACK] Seq=0 Ack=1113298373 Win=0 Len=0 43
46 0.193167 0.000056000 100.68.81.21 100.68.81.22 2380 → 58198 [RST, ACK] Seq=0 Ack=1739165024 Win=0 Len=0 46
47 0.193286 0.000119000 100.68.81.21 100.68.81.22 2380 → 58199 [RST, ACK] Seq=0 Ack=3827463043 Win=0 Len=0 47
50 0.286874 0.000073000 100.68.81.23 100.68.81.22 2380 → 58201 [RST, ACK] Seq=0 Ack=1641220058 Win=0 Len=0 50
51 0.286874 0.000000000 100.68.81.23 100.68.81.22 2380 → 58200 [RST, ACK] Seq=0 Ack=1825411290 Win=0 Len=0 51
./var/run/log/etcd.log:1556:2025-02-13T12:59:27Z Wa(4) etcd[28532348]: health check for peer 7312e1f21f195833 could not connect: dial tcp 100.68.81.21:2380: connect: connection refused
./var/run/log/etcd.log:1557:2025-02-13T12:59:30Z Wa(4) etcd[28532348]: health check for peer 5c34e4f236d566f0 could not connect: dial tcp 100.68.81.23:2380: connect: connection refused
./var/run/log/etcd.log:1558:2025-02-13T12:59:30Z Wa(4) etcd[28532348]: health check for peer 5c34e4f236d566f0 could not connect: dial tcp 100.68.81.23:2380: connect: connection refused
./var/run/log/etcd.log:1560:2025-02-13T12:59:32Z Wa(4) etcd[28532348]: health check for peer 7312e1f21f195833 could not connect: dial tcp 100.68.81.21:2380: connect: connection refused
./var/run/log/etcd.log:1561:2025-02-13T12:59:32Z Wa(4) etcd[28532348]: health check for peer 7312e1f21f195833 could not connect: dial tcp 100.68.81.21:2380: connect: connection refused
./var/run/log/etcd.log:1562:2025-02-13T12:59:35Z Wa(4) etcd[28532348]: health check for peer 5c34e4f236d566f0 could not connect: dial tcp 100.68.81.23:2380: connect: connection refused
I will share my findings and thoughts with VMware support and wait for their response, because we cannot trust ChatGPT and vendor support is the main authority for their product.
just to follow up on previous mail
I checked this internally, etcd can run even if WCP/TKG isn't in use, this could be a 3 etcd node cluster, so may not be running on some hosts,
The number of half open drops are increasing because the connection requests are being denied by the other host as the service is not currently running on them.
Can you send me the output of the below command on the vcenter
/usr/lib/vmware/clusterAgent/bin/clusterAdmin cluster status
Can you also upload a full vcenter log bundle along with the host logs
What is command /usr/lib/vmware/clusterAgent/bin/clusterAdmin?
The clusterAdmin tool in VMware ESXi is a command-line utility used for managing and administering vSphere clustering functionality, particularly vSphere HA (High Availability) and DRS (Distributed Resource Scheduler) operations at the host level. This tool is part of the cluster agent infrastructure that runs on each ESXi host and handles communication between the host and vCenter Server for cluster-related operations.
Primary Functions:
Common Use Cases:
Typical Usage: The tool is usually invoked with various subcommands and parameters, such as:
This utility is primarily intended for VMware support engineers and advanced administrators who need to perform low-level cluster troubleshooting or maintenance operations that aren't available through the vSphere Client interface. It's part of the internal clustering infrastructure and should be used carefully, typically only when directed by VMware support or when following specific troubleshooting procedures.
Well, that's the case. VMware suport engineer (TSE) was asking for command outputs, so here are outputs from all ESXi hosts in vSphere/vSAN Cluster ...
dcserv-esx05
[root@dcserv-esx05:~] /usr/lib/vmware/clusterAgent/bin/clusterAdmin cluster status
{
"state": "hosted",
"cluster_id": "5bab0e84-305e-4966-ae6e-b9386c6b19f3:domain-c2051",
"is_in_alarm": false,
"alarm_cause": "",
"is_in_cluster": true,
"members": {
"available": false
}
}
[root@dcserv-esx05:~]
dcserv-esx06
[root@dcserv-esx06:~] /usr/lib/vmware/clusterAgent/bin/clusterAdmin cluster stat
us
{
"state": "hosted",
"cluster_id": "5bab0e84-305e-4966-ae6e-b9386c6b19f3:domain-c2051",
"is_in_alarm": true,
"alarm_cause": "Timeout",
"is_in_cluster": true,
"members": {
"available": false
}
}
[root@dcserv-esx06:~]
dcserv-esx07
[root@dcserv-esx07:~] /usr/lib/vmware/clusterAgent/bin/clusterAdmin cluster stat
us
{
"state": "hosted",
"cluster_id": "5bab0e84-305e-4966-ae6e-b9386c6b19f3:domain-c2051",
"is_in_alarm": false,
"alarm_cause": "",
"is_in_cluster": true,
"members": {
"available": false
}
}
[root@dcserv-esx07:~]
dcserv-esx08
[root@dcserv-esx08:~] /usr/lib/vmware/clusterAgent/bin/clusterAdmin cluster stat
us
{
"state": "standalone",
"cluster_id": "",
"is_in_alarm": false,
"alarm_cause": "",
"is_in_cluster": false,
"members": {
"available": false
}
}
[root@dcserv-esx08:~]
dcserv-esx09
[root@dcserv-esx09:~] /usr/lib/vmware/clusterAgent/bin/clusterAdmin cluster stat
us
{
"state": "hosted",
"cluster_id": "5bab0e84-305e-4966-ae6e-b9386c6b19f3:domain-c2051",
"is_in_alarm": false,
"alarm_cause": "",
"is_in_cluster": true,
"members": {
"available": true
},
"namespaces": [
{
"name": "root",
"up_to_date": true,
"members": [
{
"peer_address": "dcserv-esx09.dcserv.cloud:2380",
"api_address": "dcserv-esx09.dcserv.cloud:2379",
"reachable": true,
"primary": "yes",
"learner": false
}
]
}
]
}
[root@dcserv-esx09:~]
dcserv-esx10
[root@dcserv-esx10:~] /usr/lib/vmware/clusterAgent/bin/clusterAdmin cluster stat
us
{
"state": "standalone",
"cluster_id": "",
"is_in_alarm": false,
"alarm_cause": "",
"is_in_cluster": false,
"members": {
"available": false
}
}
[root@dcserv-esx10:~]
It seems to me that output above means that hosts
VMware TSE mentioned that ... "etcd can run even if WCP/TKG isn't in use, this could be a 3 etcd node cluster". However, I see etcd service running only on two of six ESXi hosts. TSE believes there should be running 3 nodes. It leads into the following questions ...
Q1: What is the purpose of 3-node ETCD in vSphere/vSAN cluster?
Q2: Why only 2-nodes are running?
Anyway. I do not understand /usr/lib/vmware/clusterAgent/bin/clusterAdmin tool. This is VMware low level internal tool. So let's wait for next VMware Support follow up.
System Logs from vCenter along with the host logs have been exported and uploaded to VMware Support Case. I'm looking forward to seeing if this will help VMware support to identify the root cause.
VMware Support team opened PR (Problem Report) with VMware Engineering team.
They asked me to run ...
python3 dkvs-cleanup.py -d ignore -w skip -s norestart
... however, I have never get email notification about support case and just got email that my case was closed and I can provide survey about my experience with the case.
To be honest, my experience was far from perfect and I was not able to re-open closed ticket.
I give up, because it seems that the problem does not have any negative business impact and I have no more energy to find the root cause.
I have stored provided script at https://github.com/davidpasek/vmware-gss-scripts/blob/main/dkvscleanup32.py
Below is the output from provided script ...
[root@dcserv-esx05:/tmp]python /tmp/dkvscleanup32.py -d ignore -w skip -s norestartTraceback (most recent call last): File "/tmp/dkvscleanup32.py", line 9, in <module> import psycopg2 ModuleNotFoundError: No module named 'psycopg2' [root@dcserv-esx05:/tmp]
This does not lead anytime and support case is closed, so the root-cause is unknown, but it does not have any business impact, so I give up.
Here are scrrenshot from Canonical webcast
Feature comparison

OpenStack technological stack

System containers (LXD) vs Application Containers (Docker)

Source: https://checkmk.com/
Search Engine for the Internet of Everything
Shodan is the world's first search engine for Internet-connected devices. Discover how Internet intelligence can help you make better decisions.
Network Monitoring Made Easy
Within 5 minutes of using Shodan Monitor you will see what you currently have connected to the Internet within your network range and be setup with real-time notifications when something unexpected shows up.
