Here is the dd command
dd if=FreeBSD-14.2-RELEASE-amd64-memstick.img of=/dev/da1 bs=1M conv=sync status=progress
Here is the dd command
dd if=FreeBSD-14.2-RELEASE-amd64-memstick.img of=/dev/da1 bs=1M conv=sync status=progress
Go to https://github.com/massgravel/Microsoft-Activation-Scripts and follow the instructions.
Or download Windows LTSC (Long-Term Servicing Channel) from https://massgrave.dev/windows_ltsc_links#win11-iot-enterprise-ltsc-2024
Windows LTSC is intended for IoT and does not require a product key.
If so try installing the libnsl package via the command dnf install libnsl then then try deploying again!
vCenter Server 8.0 appliance deployment fails while performing vCenter server 8.0 deployment using a UI installer on the RHEL 9 operating system, the deployment wizard fails with an error message: A problem occurred while reading the OVA File: TypeError: Cannot read properties of undefined reading 'length'.
On the RHEL operating system, install the libnsl package using the command
dnf install libnsl.
Ensure to configure the required repositories prior to execution of the command.
#VCSA, #OVF, #OVA
I have just finished my first VMware vSAN ESA Plan, Design, Implement project and had a chance to test vSAN ESA performance. Every storage should be stressed and tested before being put into production. VMware's software-defined hyperconverged storage (vSAN) is no different. It is even more important because the server's CPU, RAM, and Network are leveraged to emulate enterprise-class storage.
9.6 Gb/s of transmit pure network traffic requires 1681 MHz (1.68 GHz) of CPU usage
10,307,921,510 b/s transmit traffic requires 1,681,000,000 Hz1 b/s transmit traffic requires 0.163 Hz1 Gb/s transmit traffic requires 163 MHz
10 Gb/s of receive pure network traffic requires 4000 MHz (4 GHz) of CPU usage
10,737,418,240 b/s transmit traffic requires 4,000,000,000 Hz1 b/s receive traffic requires 0.373 Hz1 Gb/s receive traffic requires 373 MHz
Step 1: upload the VMware-ESXi-8.0U3b-24280767-depot.zip file to a datastore accessible by the host.
esxcli software sources profile list -d /vmfs/volumes/[datastore]/VMware-ESXi-8.0U3b-24280767-depot.zip
esxcli software profile update -d “/vmfs/volumes/[datastore]/VMware-ESXi-8.0U3b-24280767-depot.zip” -p ESXi-8.0U3b-24280767-standard
cd /usr/lib/applmgmt/support/scripts
./software-packages.py stage --url --acceptEulas
./software-packages.py list --staged
./software-packages.py validate
./software-packages.py install
Download the VCSA patch which should end with FP.iso from support.brocade.com > selecting VC and the version.
Upload the file to a datastore and map it to the VCSA VM through CD / DVD Drive option.
Patch the VCSA from CLI.
Run the following commands
software-packages.py stage –-iso
software-packages.py list –-staged
software-packages.py install –-staged
Reboot the VCSA VM.
This should patch the VCSA
#!/bin/bash
sshfs david.pasek@gmail.com@sftp.virtix.cloud:./ ~/mnt/sftp -p 55022
Web Admin Management Interface (SunStone) is at https://[IP]:2616
Main Admin User Name: oneadmin
Default network is 172.16.100/24
Source: https://vmattroman.com/monitoring-vmware-vsphere-with-zabbix/
Zabbix is an open-source monitoring tool designed to oversee various components of IT infrastructure, including networks, servers, virtual machines, and cloud services. It operates using both agent-based and agentless monitoring methods. Agents can be installed on monitored devices to collect performance data and report back to a centralized Zabbix server.
Zabbix provides comprehensive integration capabilities for monitoring VMware environments, including ESXi hypervisors, vCenter servers, and virtual machines (VMs). This integration allows administrators to effectively track performance metrics and resource usage across their VMware infrastructure.
In this post, I will show you how setup Zabbix monitoring with VMware vSpehre infrastructure.
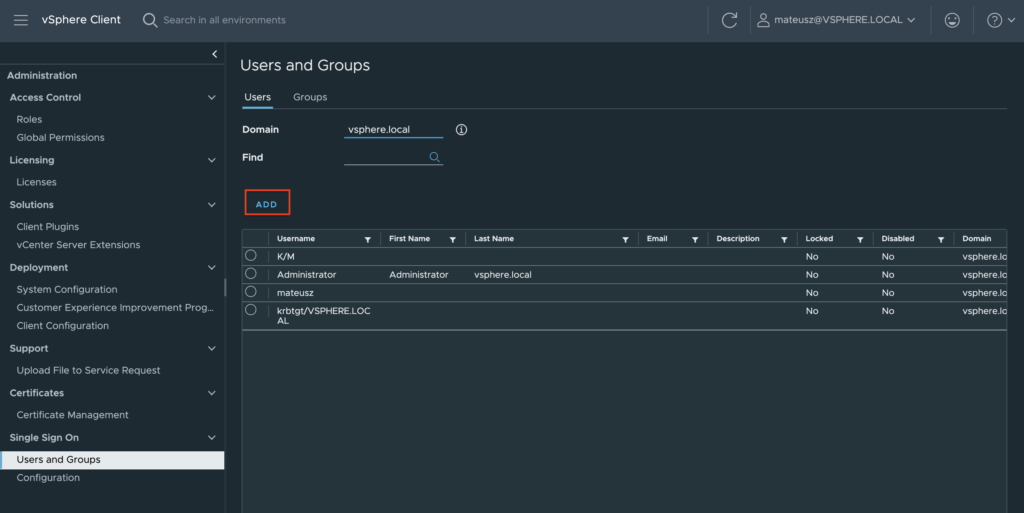
At first, let’s create service user on the vCenter that will be used by Zabbix server to collect data. To make life easier, in my in lab setup user zabbix@vsphere.local will have full Administrator privileges. But, Read-Only permissions should be enough.
1. In vSphere Client choose Menu -> Administration -> Users and Groups. From Users tab, select Domain vsphere.local and click ADD button to add a new user.
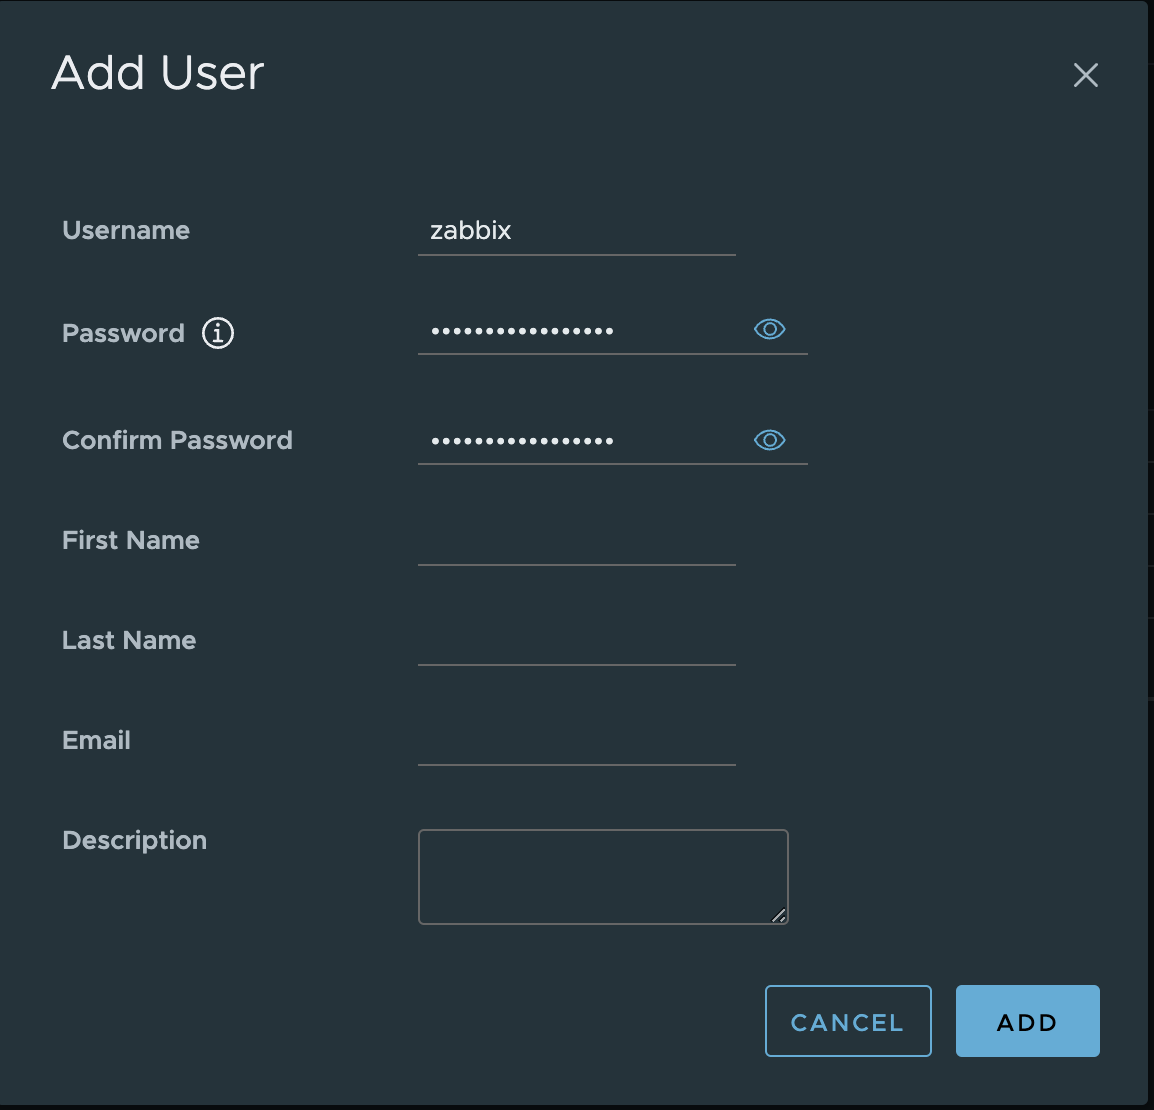
2. Type a username and password. Click ADD to create a new user.
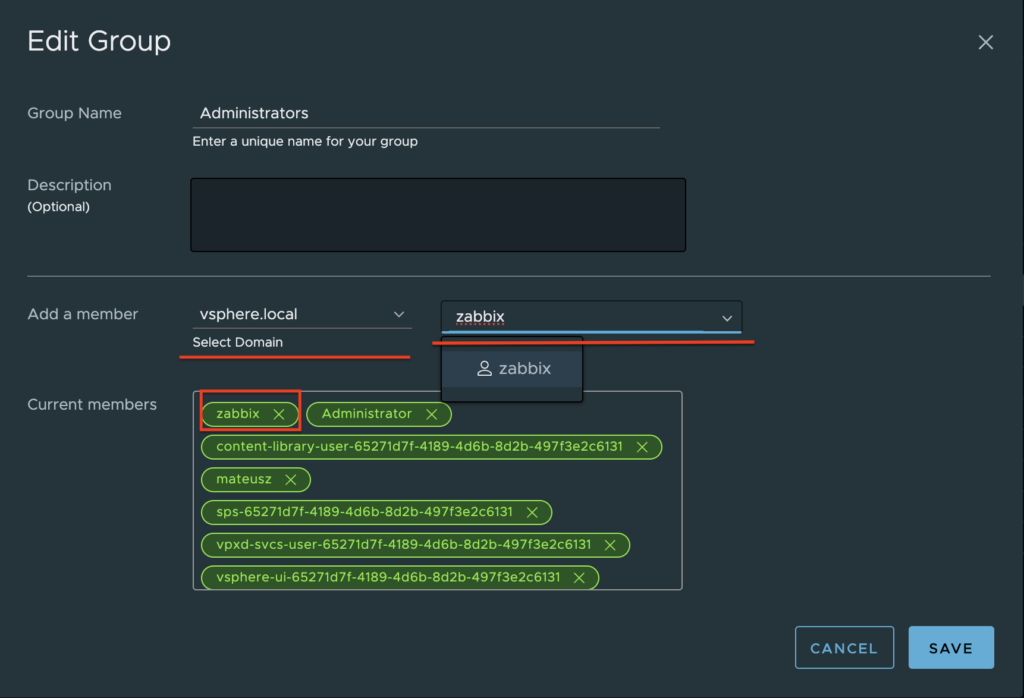
3. Change tab to Groups and select Administrators group.
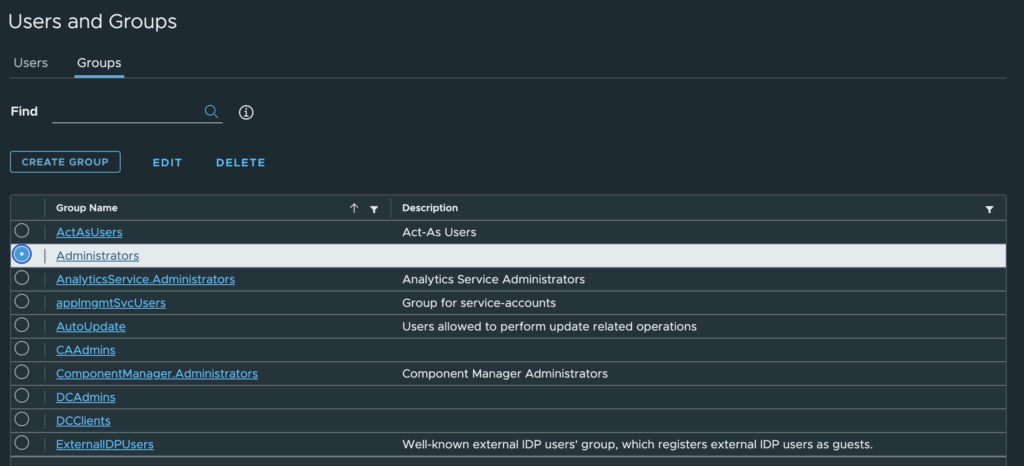
4. Find a new user zabbix, click on it and save. User is added to the Administrators group.
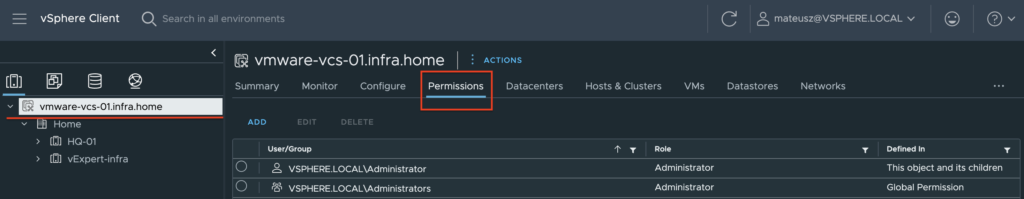
5. From the Host and Clusters view, choose vCenter name and go to the Permissions tab. Click Add button.
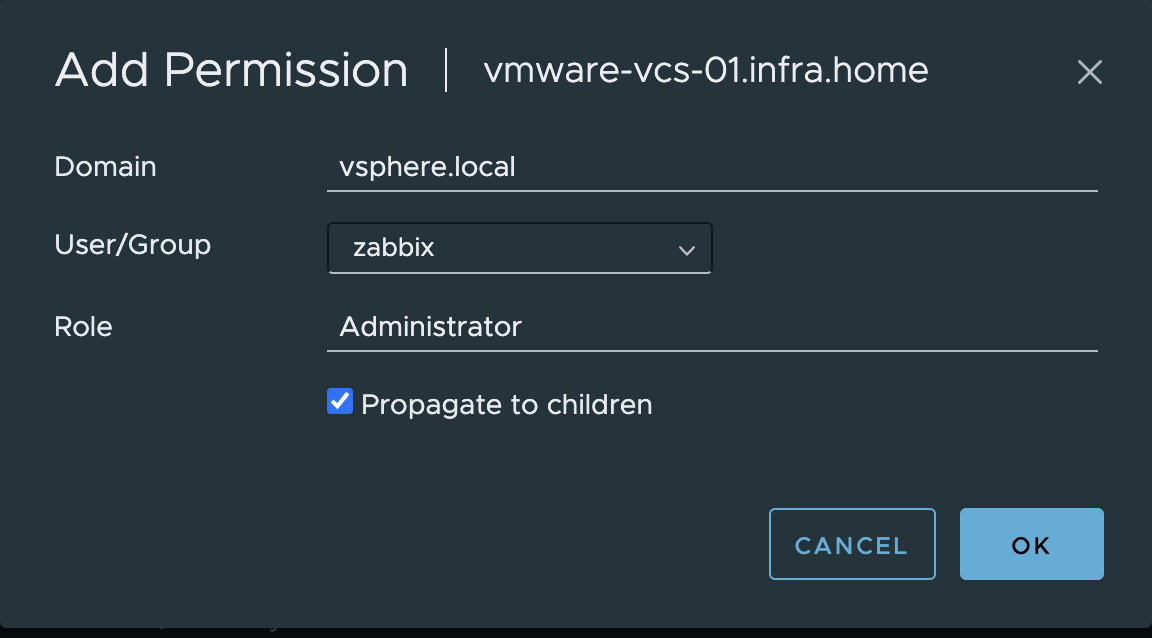
6. Choose a proper domain (vsphere.local), find user zabbix , set role to Administrator and check Propagate to children. Click OK to give that permissions.
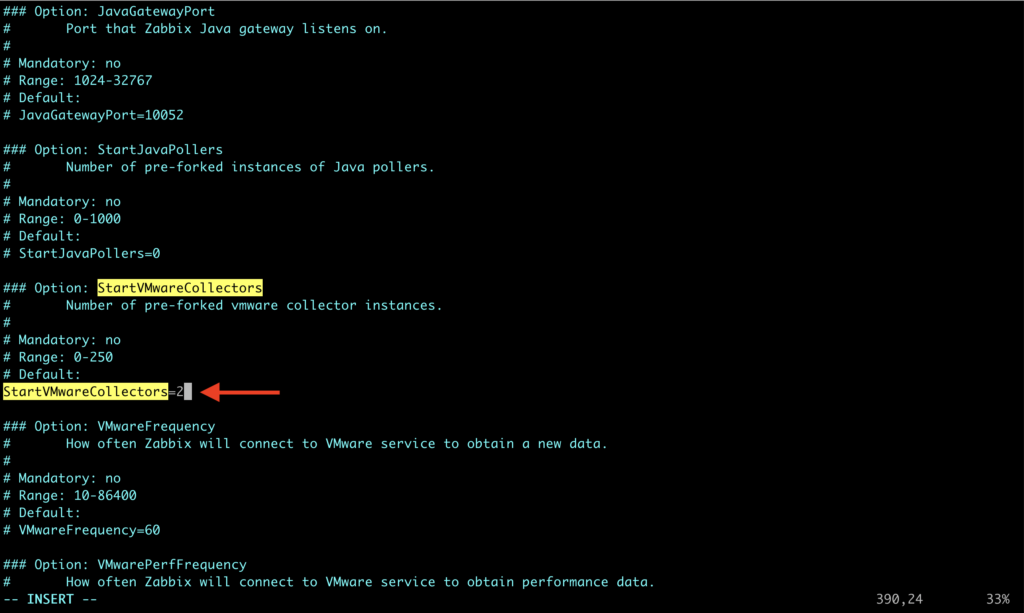
Next, we need to edit zabbix_server.conf. In this file we need to enable vmware collector process. It’s necessary to start VMware monitoring.
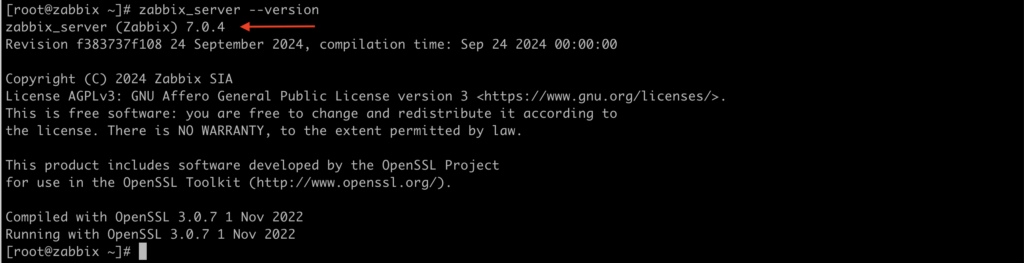
FYI, I have installed Zabbix server in version 7.0.4.
1. Edit a configuration file zabbix_server.conf

vim /etc/zabbix/zabbix_server.conf2. Find StartVMwareCollectors parameter, delete “#” before it and change value from 0 to at least 2.
Save a file and exit.
Except for StartVMwareCollectors which is mandatory, it’s possible to enable and modify additional VMware parameters. More details about them, you can find HERE.
VMwareCacheSize
VMwareFrequency
VMwarePerfFrequency
VMwareTimeout
3. Restart zabbix-server service.

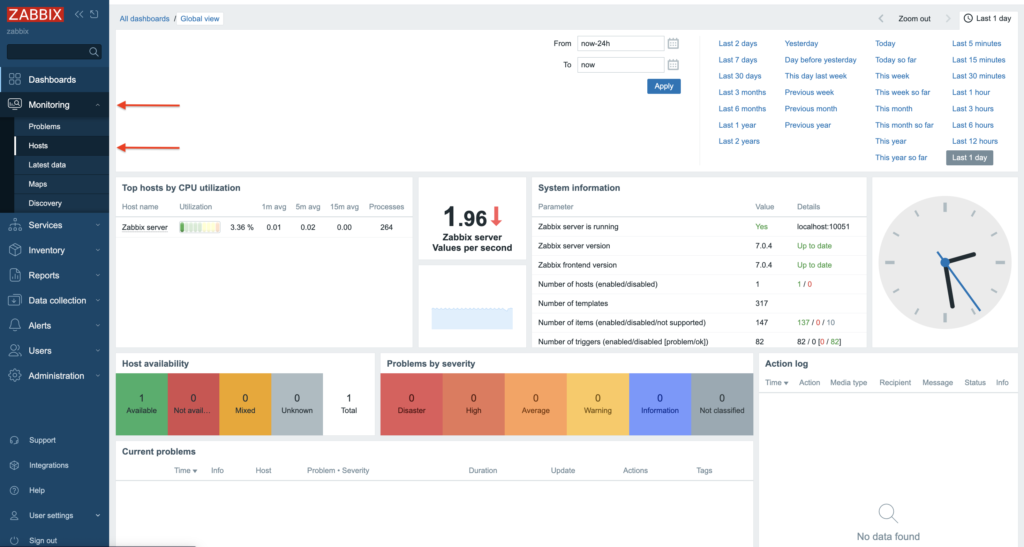
systemctl restart zabbix-server1.Log in to the Zabbix server via GUI – http://zabbix_server/zabbix
Go to the Hosts section under Monitoring tab.
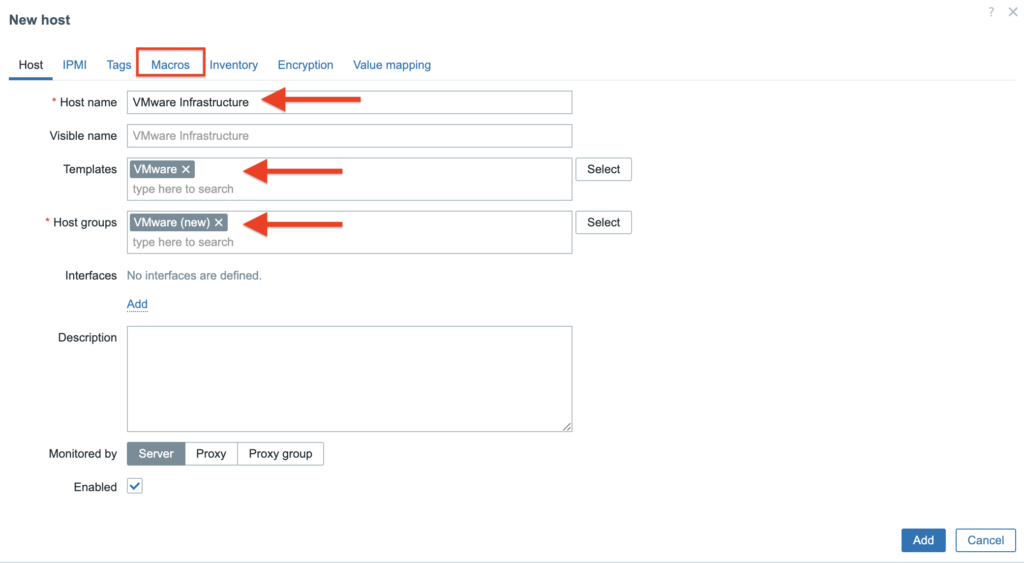
2. Create a new “Host”. Click Create Host in the right upper corner.

3. In the Host tab provide the following details:
Host name – type a name of the system that we want to monitor, here is VMware Infrastructure;
Templates – type/find template name “VMware”, more info about VMware template you can find HERE;
Host groups – find/type “VMware(new)” host group.
Than, go to the Macros tab.
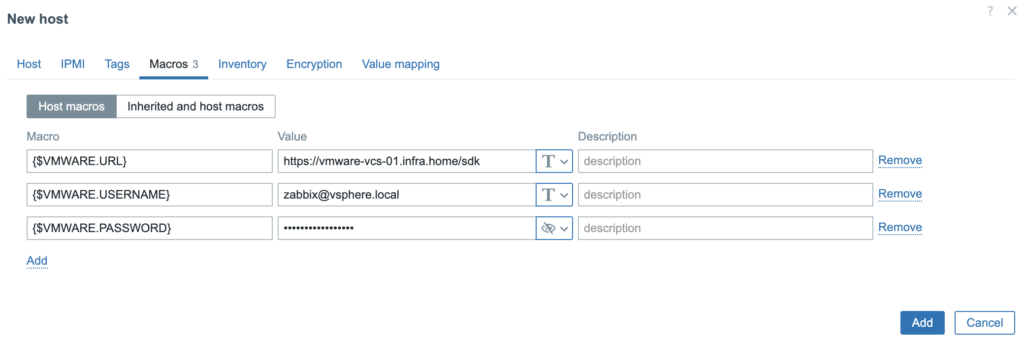
4. In the Macros tab you need to provide 3 values/macros. These macros describes data that it’s needed to connect Zabbix to the VMware vCenter.
{$VMWARE.URL} – VMware service (vCenter or ESXi hypervisor) SDK URL (https://servername/sdk) that we want to connect;
{$VMWARE.USERNAME} – VMware service username created in the 1 section;
{$VMWARE.PASSWORD} – VMware service user password created in the 1 section.
Click Add button.
5. New Host was created and collecting data is in progress.
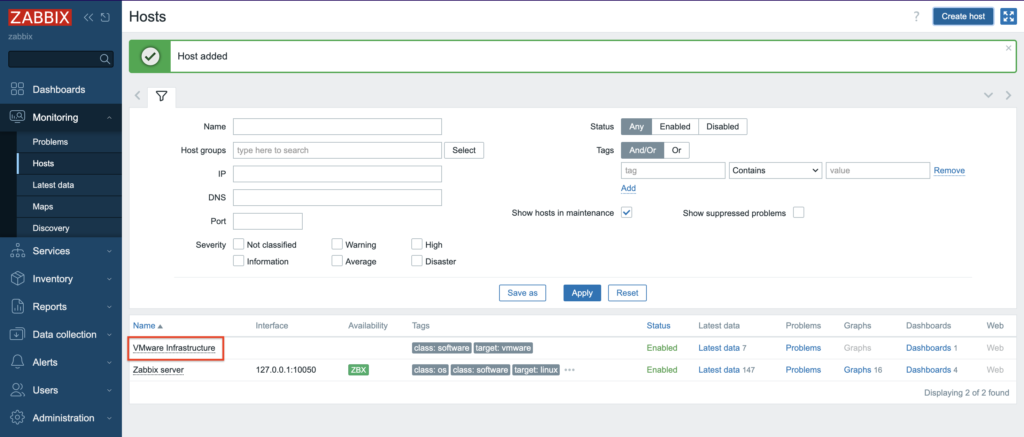
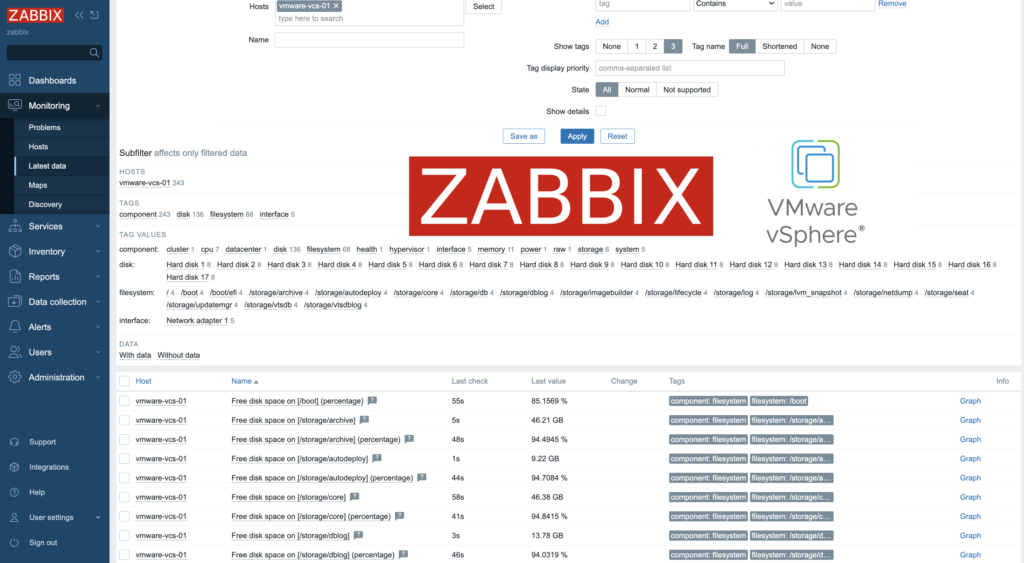
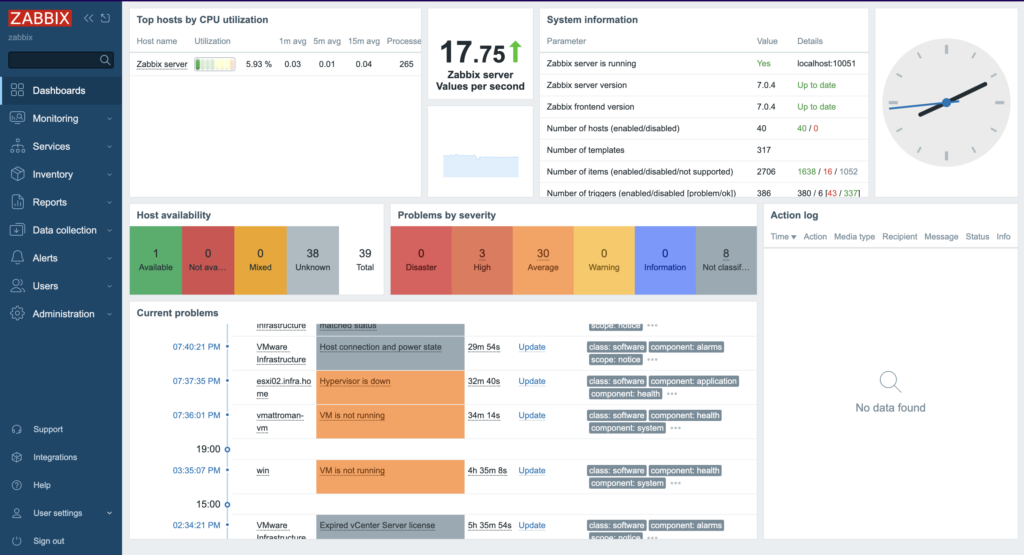
6. Depending on the size of the infrastructure, data collection takes different times. Once configured, Zabbix will automatically discover VMs and begin collecting performance data. Overview of the lates data, you can find in the Dashboard screen.
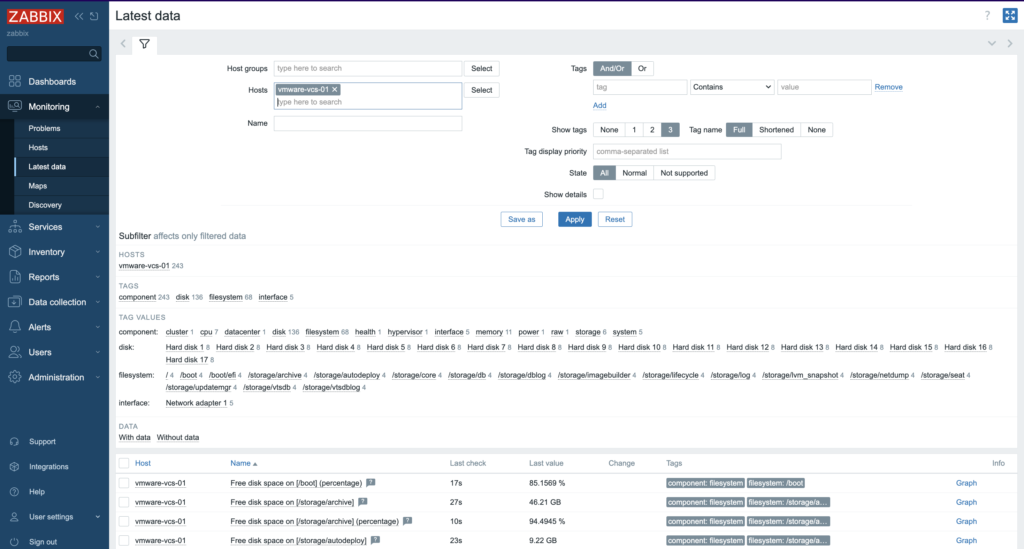
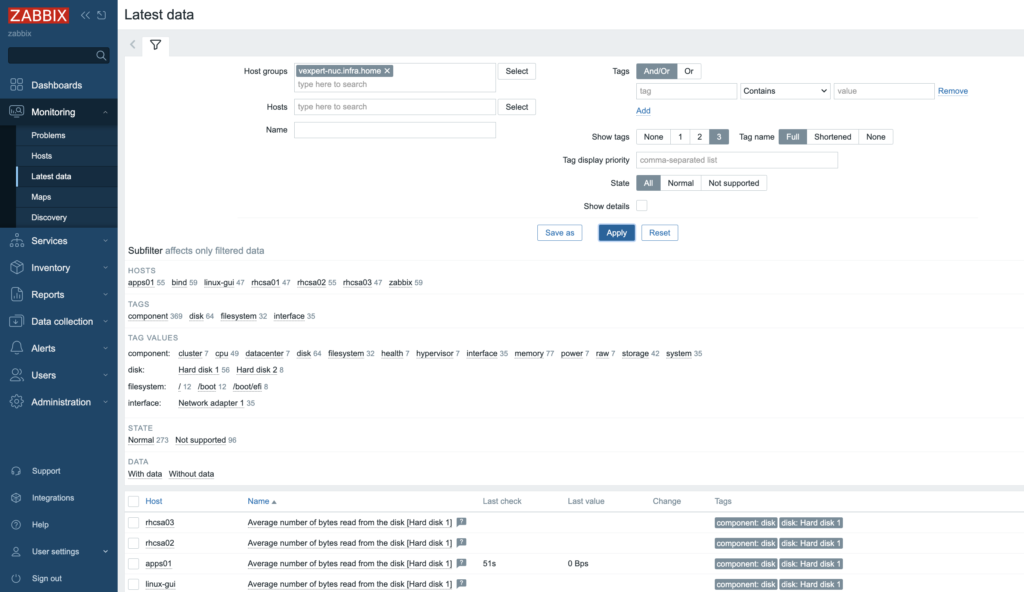
7. More specific and detailed data, you can find in the Latest data under the Monitoring tab.
In Host groups or Hosts type (or click “Select” button) the name of the item you are looking for. Name of the ESXi host, virtual machine, vCenter name, datastore or all VMware information.
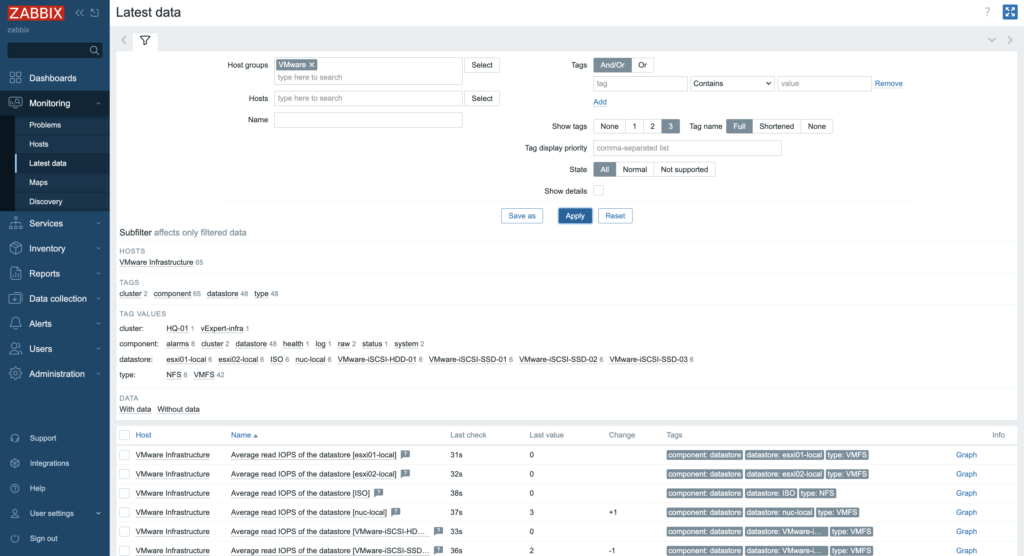
Zabbix can collect various metrics from VMware using its built-in templates. These metrics include:
– CPU usage
– Memory consumption
– Disk I/O statistics
– Network traffic
– Datastore capacity
In summary, integrating Zabbix with VMware provides a robust solution for monitoring virtualized environments, enhancing visibility into system performance and resource utilization while enabling timely alerts and responses to operational issues.
Jak zabránit čekání na obnoveni NFS datastore při startu ESXi?
Když vám ESXi odmítá startovat 1-2 hodiny, protože se pokouší připojit NFS datastore, které jsou dávno odstraněné.
Source: https://vmattroman.com/backup_

In some cases we need to reinstall ESXi host. To avoid time consuming setting up servers, we can quickly backup and restore host configuration. To achieve this, there are three possible ways: ESXi command line, vSphere CLI or PowerCLI.
In this article I will show how backup and restore host configuration data using ESXi command line.
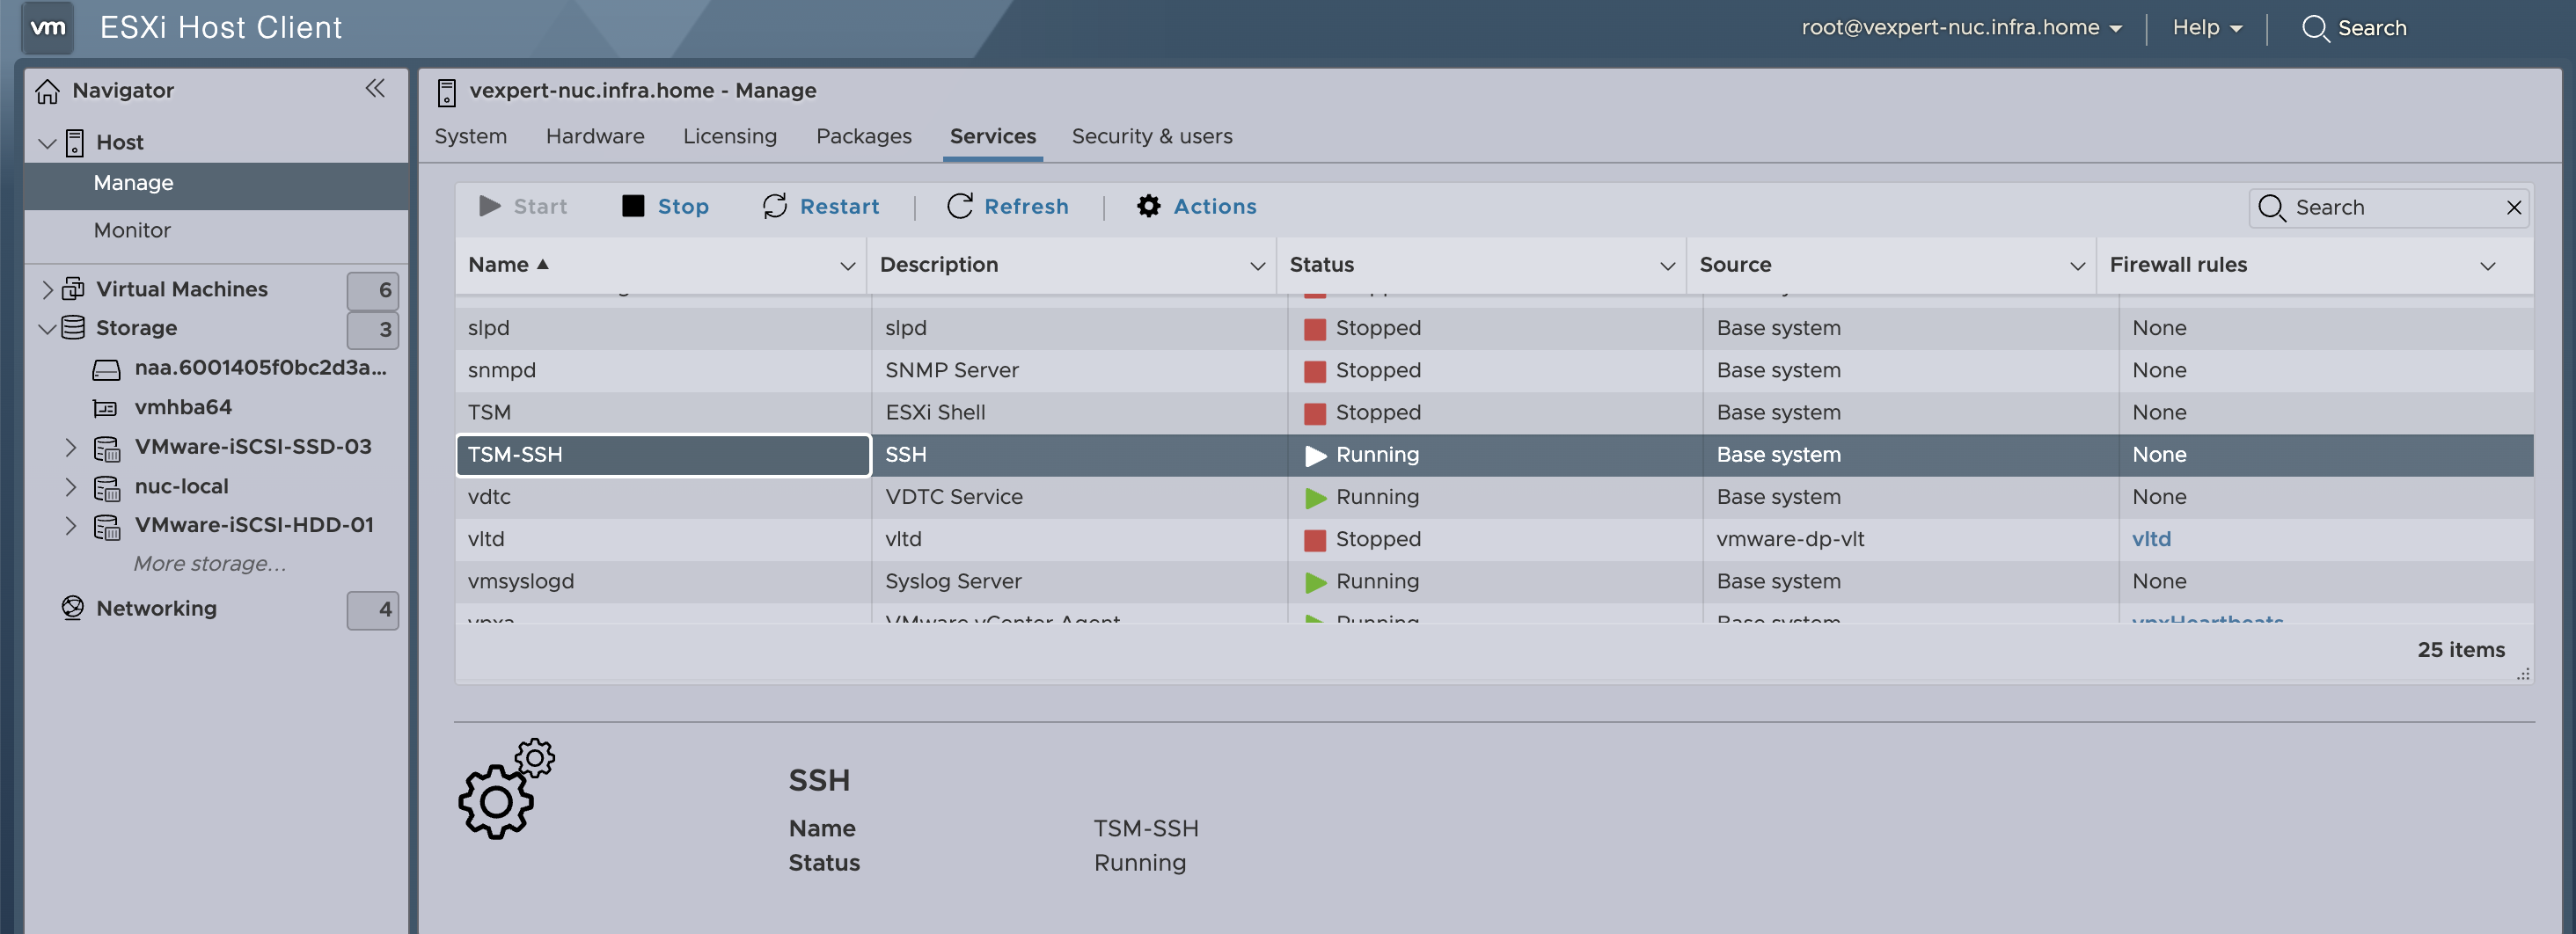
1. Enable SSH service on the ESXi host.
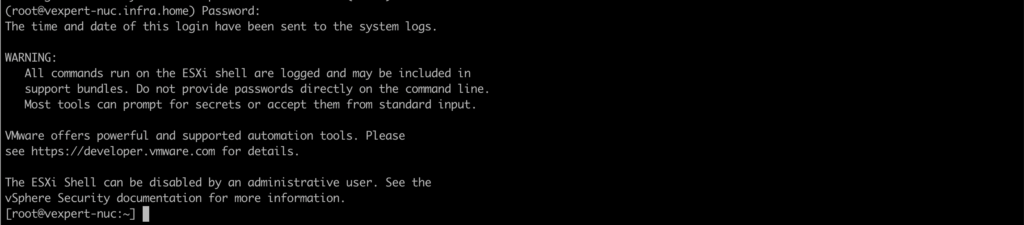
2. SSH to the ESXi host.
3. Synchronize the configuration changed with persistent storage with a command:
vim-cmd hostsvc/firmware/sync_config
4. Back-up the configuration data for the ESXi host with a command:
vim-cmd hostsvc/firmware/backup_config5. Copy generated http:// address to the web browser. In place of asterisk ‘*‘ put FQDN or IP of your ESXi host. Download the file.

6. This is a download ESXi data backup file:

1. Rename previously downloaded backup file from configBundle-vexpert-nuc.infra.home.tgz to configBundle.tgz
2. Put the host into maintenance mode with this command or from the web client:
vim-cmd hostsvc/maintenance_mode_enter3. Copy configBundle.tgz to one of the available datastore in the host and reboot ESXi.
4. Than, move your backup file configBundle.tgz to /tmp
5. To restore the ESXi host configuration run this command:
vim-cmd hostsvc/firmware/restore_config 06. Exit from maintenance mode with a command:
vim-cmd hostsvc/maintenance_mode_exit